Don't Be a Victim of Market Manipulation
Why 90% of retail investors lose
Market makers hold more information and more capital. Without the right tools, retail becomes their exit liquidity.
- 1
Accumulation
Bandar quietly builds a position at low prices while the chart still looks boring.
- 2
Markup & FOMO
Price rallies, headlines appear, and retail piles in at the top chasing the move.
- 3
Distribution & collapse
Bandar sells into that demand — then price collapses, leaving retail trapped.
Trapped at the top
Retail buys on FOMO when prices are high — right as market makers begin distributing.
Following without analysis
Chasing influencer calls without knowing who is actually moving the price.
Missing hidden volume
Market makers disguise accumulation by splitting large orders into small ones.
Cutting losses too late
Realizing heavy losses only after distribution ends and the price collapses.
Fooled by fake breakouts
False breakouts engineered to lure retail in just before the dump.
Wrong entry & exit timing
Entering too early or exiting too late with no read on market-maker movement.
From blind spots to a clear edge
Every retail trap maps to a tool. Here's how the data turns market-maker behaviour into decisions you can act on.
Missing hidden volume — solved
See accumulation before it shows in price
Bandar splits large orders to stay invisible. We surface the divergence — net buying climbs while price stays flat — so you spot the build-up early.
- Net broker flow vs. price divergence
- Hidden-order accumulation scoring
- Alerts when a build-up starts to form
Wrong entry & exit timing — solved
Time your moves with conviction
No more buying tops and selling bottoms. Get clear entry and exit zones derived from market-maker behaviour, not lagging price indicators.
- Entry zones at accumulation lows
- Exit warnings before distribution
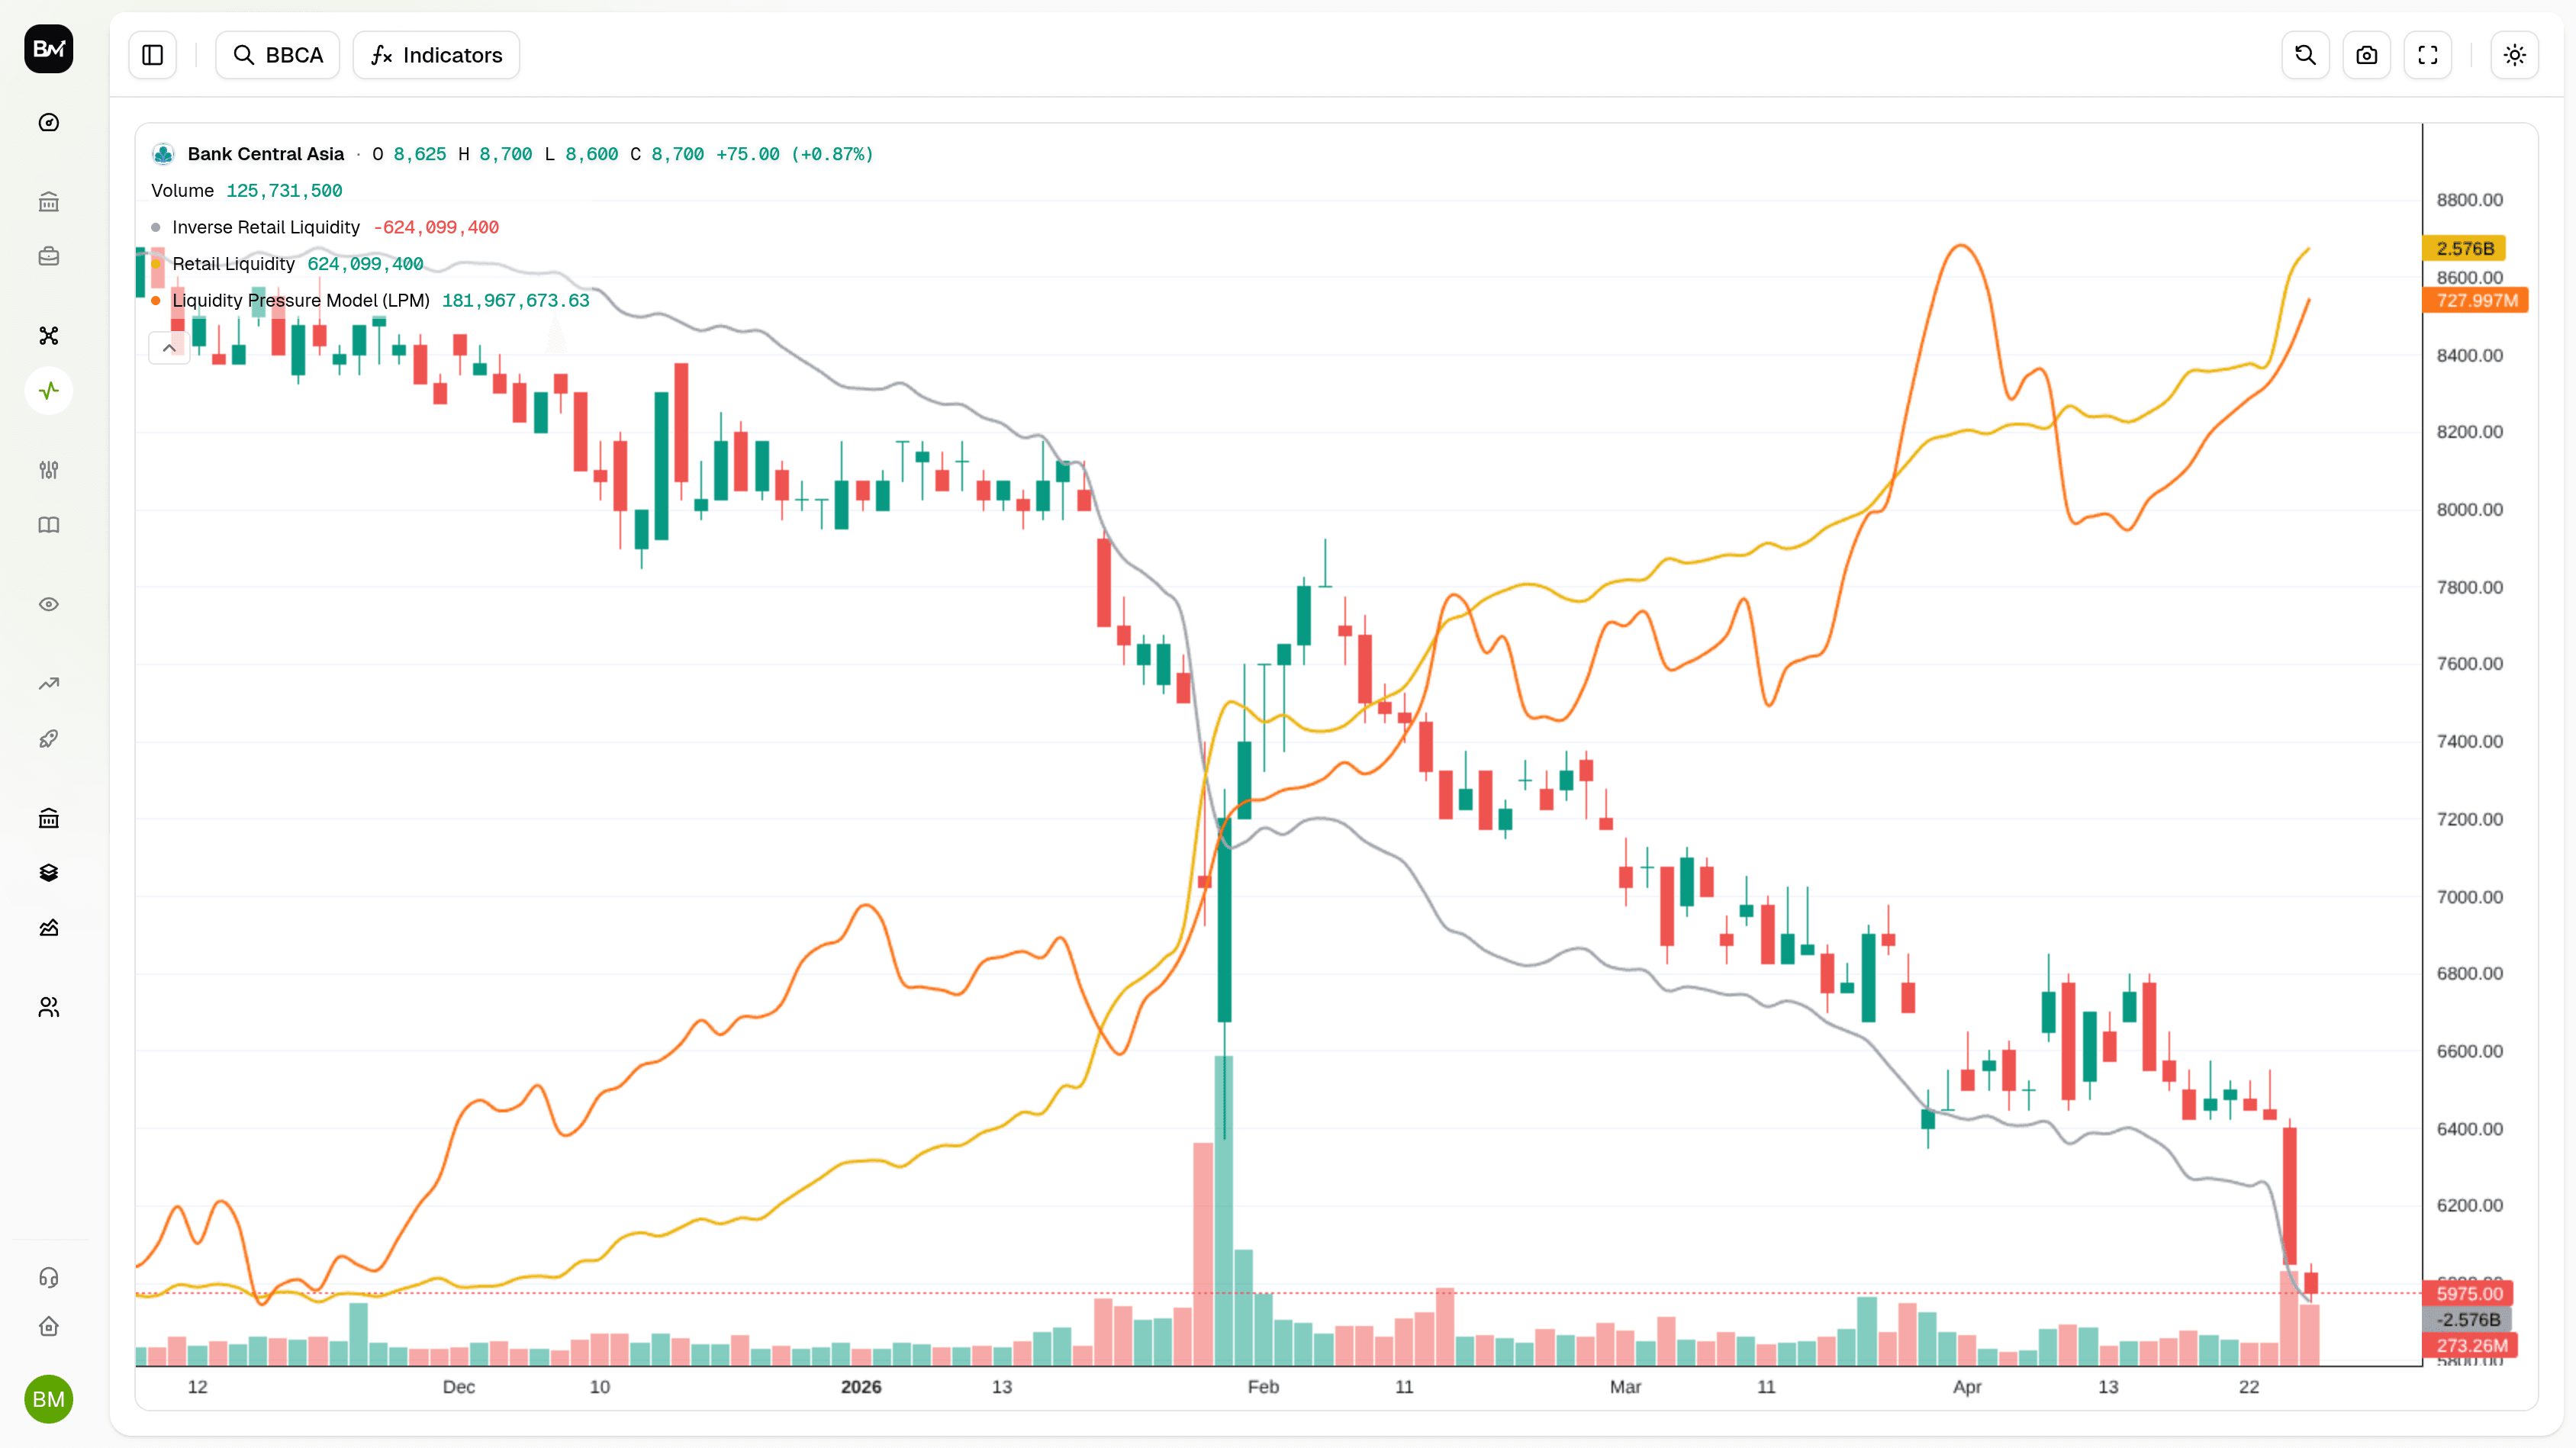
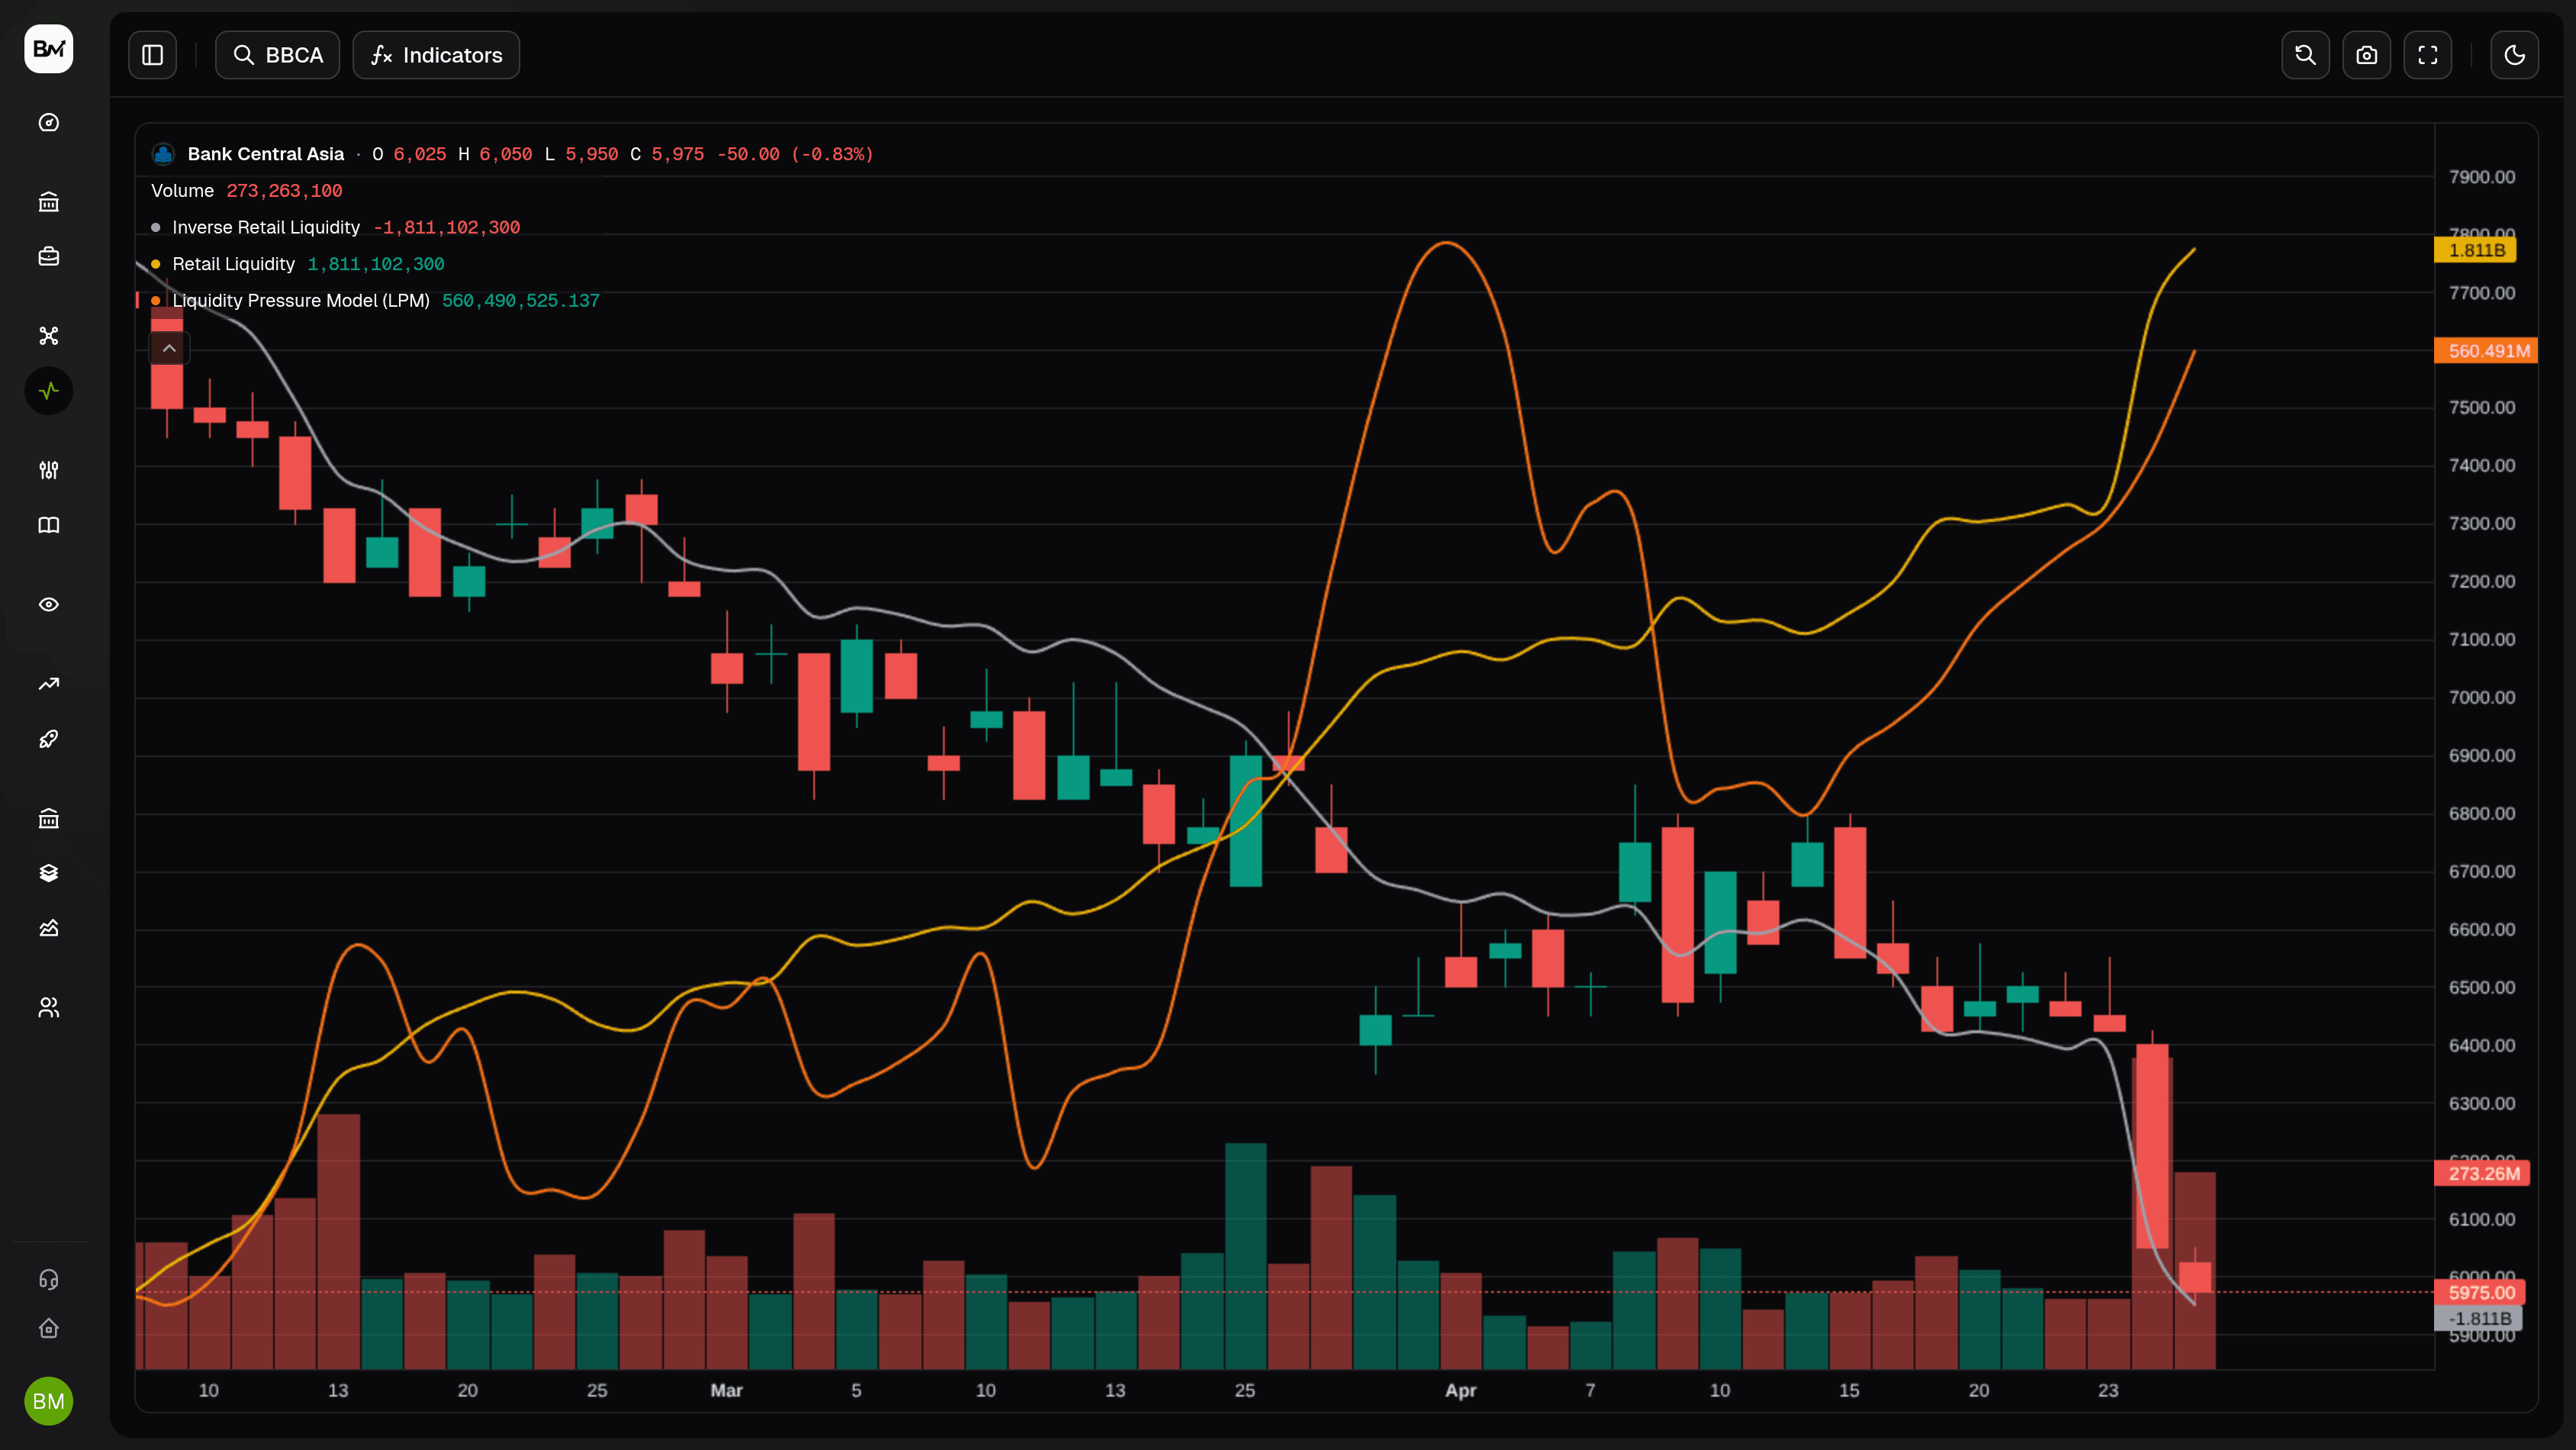
- Liquidity Pressure Model overlay
Following without analysis — solved
Know exactly who's moving the price
Stop guessing. See the real broker summary behind every move — who is accumulating, who is distributing, and how aggressively.
- Net buy / sell by broker
- Top accumulator & distributor ranking
- Per-stock institutional footprint
The whole market, on one screen
A live snapshot of the Indonesia Stock Exchange — IHSG chart, most-active movers, market summary and a sector heatmap. No login required.
- IHSG live chart
- Most-active movers
- Market summary
- Sector heatmap
One proprietary algorithm. Total clarity.
Bandar Metrics analyzes volume, price action, and order flow to surface market-maker movement before the crowd sees it.
Accumulation detection
An advanced algorithm that exposes hidden accumulation from volume and price action.
Entry & exit signals
Clear prompts on the strongest moments to enter and exit a position.
Distribution analysis
Know when market makers start selling — before the price falls.
Money flow analysis
Track large capital moving in and out of every stock.
Historical data
Study past market-maker patterns with deep historical depth.
Straight from the traders who use it.
Saya mau ngucapin terima kasih sebanyak banyaknya kepada developer BM, ini toolsnya gacor banget
Abdul Kadir
Pick how deep you want to go.
Start with market structure, add bandarmology and the screener, or go all in with insight sessions and early access. Each plan includes everything below it.
Website access with the core market analysis tools.
- Stock Ownership Map & Information
- Foreign Domestic Activity & Market Mover Information
- Broker Flow & Broker Activity
- Stock Calculator
- Trading Journal
- Colour Vision palettes
- Market Structure
All Basic features + Special Tools, Bandarmology Education, and Stock Insight.
- Everything in Basic, plus:
- Bandar Metrics Special Tools (LPM, Intensity, Volume Rotation, Foreign Flow, etc.)
- BM Education & Webinar
- Basic Technical & Risk Money Management Education
- Smart Money Screener
- Telegram screener alerts
- Trading Journal spreadsheet import
- Chart Detective
Insight sessions, community and early access
≈ Rp 250.000 /month
Subscribe NowAll Pro features + Webinar, Weekly Meeting, Daytrade, Fundamental, and exclusive Telegram Group access.
- Everything in Pro, plus:
- Stock Insight (Bedah Emiten Webinar)
- Weekly Meeting (Report + Stock Screening Session)
- Daytrade (Technical Insight)
- Fundamental & Money Management Insight
- Early access to new features
Frequently asked questions
Quick, comprehensive answers about the platform, the data, and how traders use it.
Can't find what you're looking for? Contact our customer support team.
Read the market like smart money does
Retail loses when it trades without understanding market structure and institutional flow. Bandar Metrics gives you that edge.
Not Financial Advice
Bandar Metrics provides market analytics for informational and educational purposes only. Nothing on this platform is financial advice or a recommendation to buy, sell, or hold any security. All trading and investment decisions — and their outcomes — are yours alone.
Read the full disclaimer